Types of Maps in the Drone Mapping
The Drone mapping or aerial surveying in construction yields maps as the final deliverables. Photogrammetry and LiDAR are the 2 prevalent methods used for drone mapping, Each offering distinct mapping results that necessitate specialized data processing software for analysis. Types of Maps in the Drone Mapping.
In this article explores the typical maps provided following a drone survey or mapping procedure.
Types of Maps in the Drone Mapping.
The common types of the maps obtained from drone mapping are:
- Orth mosaic maps.
- Digital Elevation Models (DEM).
- Digital Surface Models (DSM) & Digital Terrain Model (DTM).
- Contour line maps.
- 3D point clouds.
- 3D textured maps.
(1) – Orth mosaic Maps.
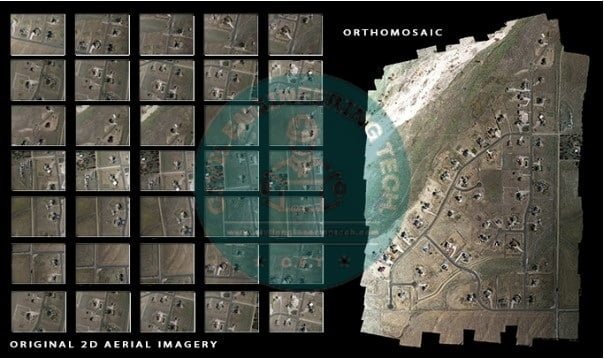
An the orthomosaic map, also known as an ortho-map, is the comprehensive top and down representation of survey site.

It is created by capturing digital images from a camera mounted on a drone, which captures a straight-down view of the survey site or asset. These images are then meticulously stitched together to form the precise 2D orthomosaic map. This mapping technique is particularly useful when surveying expansive areas.
Utilizing a drone equipped with high-resolution cameras enables the creation of precise georeferenced ortho-maps down to the centimeter level.
Read More
Derivation of formula to set out the curves by the method of ordinates from a long chord
Estimation of the Material for Concrete
Components of Road Structure
What is contour interval and Uses of contour maps in surveying
These ortho-maps offer a realistic perspective that aids in quick decision-making and thorough analysis of the project advancements.
(2) – Digital Elevation Models.
The Digital Elevation Models provide a graphical depiction of the elevation information for each specific point surveyed on the ground by drones. Rather than a realistic portrayal of the area, DEMs utilize various colors to represent differences in the elevation.

DEMs produce grids that record the maximum elevation point along the z-axis for each x and the y coordinate. The smaller grid cell indicates a higher level of intricacy within the DEM data file, offering comprehensive representations of the terrain with abundant details.
(3) Digital Surface Model and Digital Terrain Model.
DTM and DSM models are subsets of DEM. The DTM specifically showcases the pure terrain and ground, providing a bare-earth surface model. On the other hand, the DSM encompasses all the acquired points and depicts both man made and natural features present on the earth’s surface.

In the figure below, the DTM follows the ground, while the DSM illustrates the ground along with other features. The DSM shows the structures on the surface, i.e., the top of buildings & the trees.
(4) – Contour Line Maps.
The Contours or topographic maps are maps that display the elevation of the particular area using lines that connect points of the equal elevation. These lines, known as contour lines, provide information about the steepness of the terrain and help identify peaks and valleys.
Read More
how to Calculate the height of an object using With theodolite
Concrete Slump Test workability Procedure and result
What is Best Practice in the Construction
What Is The RCC Concrete And Properties of RCC Concrete
By utilizing the DTM or DSM model with the customized contour intervals, a contour line map can be generated. This map offers a more comprehensive understanding of the surface characteristics of the area captured by the drone.
(5) – 3D Point Clouds.
The densified point cloud is created from drone images using the 3D point cloud. This point cloud consists of numerous points, with each representing a geometric coordinate. Each point contains geospatial (x,y,z) and color data.

By merging all these coordinates, the 3D model is constructed. The density of the model increases as more coordinates are added.
Read More
What is the Long Wall Short Wall Method
What is the Differences between Pillar and Column
Civil Engineering Interview Questions and Answers
The 3D point clouds provide a precise representation that allows for simple measurements of distance, area, and volume.
(6) – 3D Texture Mesh.
The 3D texture mesh represents an advancement from 3D point clouds as it accurately captures the edges, faces, vertices, and texture of the surveyed area by the drone. This technology is well-suited for the visual inspections and is perfect for tracking project advancements.

Frequently Asked Questions.
What is the DEM model in the surveying?
The Digital Elevation Models (DEMs) provide a graphical depiction of the elevation information for each specific point surveyed on the ground by the drones. Rather than a literal portrayal of the terrain, DEMs utilize a color scheme to represent variations in elevation.
What is the difference between DSM and DTM models in the surveying?
The DTM offers a representation of the bare earth surface, showcasing only the natural terrain and ground, whereas the DSM includes all collected points, illustrating both man made structures & the natural features present on the surface of earth.
What are 3D point clouds in the drone surveying?
The densified point cloud is generated from the drone images, creating the 3D representation. This point cloud consists of numerous points, each representing a geometric coordinate and providing geospatial (x,y,z) and color information. By combining all these coordinates, the comprehensive 3D model is constructed. As more coordinates are added, the model becomes increasingly dense.


2 Comments